![[rss feed 圖案]](/~ckhung/i/rss.png)
Graphviz+Jessyink as a Latex-Style Potential Alternative to Prezi and Mindmap Presentations (How to Beat MS PowerPoint)
By HUNG Chao-Kuei on Sunday, August 14 2011, 22:41 - Permalink
 For those of us who prefer spending more time with
content than visual effects and prefer fiddling with
texts than mouse/button/graphics, graphviz and jessyink
could be a latex-style potential alternative to Prezi
and Mindmap presentations -- if a few improvements are made.
Please click on the picture and then use arrow keys to
navigate thru the "slides".
For those of us who prefer spending more time with
content than visual effects and prefer fiddling with
texts than mouse/button/graphics, graphviz and jessyink
could be a latex-style potential alternative to Prezi
and Mindmap presentations -- if a few improvements are made.
Please click on the picture and then use arrow keys to
navigate thru the "slides".
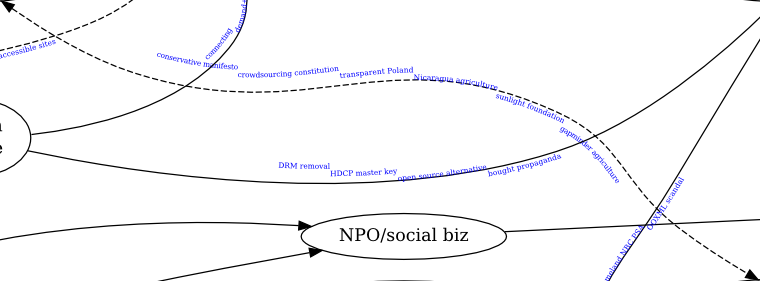
Having blogged and given speeches (mostly in Traditional Chinese) a lot about FLOSS, open file formats, any browser campaign, free culture, and government transparency, I come to see a big picture of how the Internet is transforming our society. So I drew this picture: "the Internet Phenomenon Map" and wish to make it into the presentation "slides" for my future talks. I would love to talk about the content of this picture (I did already in Chinese), but for this post we will concentrate on the technicalities of its creation.
So I begin by creating a source file net-pheno-map.dot to be processed by graphviz. (I update the dot source file frequently, but don't update the following files, so there may be some major layout discrepency that doesn't hurt the explanations.) But I'd like to have it in two languages. So I concatenate the English text and the Chinese text together as the node names (I should have used labels instead but that's a minor issue) and use "#" as a separator between the two languages. To generate the English version of the background picture, I remove the Chinese part of the strings, feed it to the dot command of graphviz to generate the raw svg, and use a small perl script ds2tp to massage the output:
perl -pe 's/#[^"]*"/"/g' net-pheno-map.dot | dot -Tsvg > 1.svg
perl -pe 's#</g>#</g>\n#' 1.svg | perl ds2tp > net-pheno-map.en.svg
The "background" svg file net-pheno-map.en.svg is then converted into png by Inkscape and further into jpg by ImageMagick (to be used as a background). Finally, I open inkscape again and:
- create a new file
- "jessyink: install"
- import the background jpg
- create a few rectangles
- "jessyink: view" to tag the order of the rectangles
- save as net-pheno-jbm.en.svg, the "slides" linked to at the beginning of this post.
I did this on mepis 11 with inkscape 0.48. Note that the default jessyink does not work. I had to remove the /usr/share/inkscape/extensions/jessyInk* files and decompress the JessyInk-1.5.5.zip file downloaded from the official site. For details of using jessyink, please read Tim Teatro's tutorial.
 The following are a few suggestions to the graphviz team and
inkscape team. I apologize for not filing official and
separate bug reports and/or feature requests due to my laziness.
I hope this blog post proves to be useful to the FLOSS
community nontheless. First comes some bug reports:
The following are a few suggestions to the graphviz team and
inkscape team. I apologize for not filing official and
separate bug reports and/or feature requests due to my laziness.
I hope this blog post proves to be useful to the FLOSS
community nontheless. First comes some bug reports:
- You can see that the relative positions between the background image and the rectangle "view" boxes are not exactly consistent between firefox and inkscape.
- Somehow applying jessyink to the original svg file net-pheno-map.en.svg produces an svg file without special effect. That's why I resorted to producing the jpeg file as a background image to be imported again in a new jessyink-svg file.
- Originally I used a slightly longer script to generate the background svg file net-pheno-nocr.en.svg. This file pack several "tspan" tags into a single textPath tag and is slightly more concise than the successful one (which has multiple textPath tags each containing tspan tags). However, in inkscape it displays in a staircase manner -- much like how text files with line feed (\n) but without carriage return (\r) displayes in DOS. Or windows. Whatever. It displays ok in firefox 4.0.1. I didn't study the svg spec, but it seems that the way firefox renders it makes more sense to an end user.
Here are a few feature requests that could make graphviz and jessyink to be an interesting alternative to prezi that appeal to people with the vim/regexp/grep/sed/awk/perl mindset (like me). It would be nice if
- there is a gettext-like capability in graphviz so that a graphs in different langages can be created from the same .dot file (with language sections, or plus language files);
- edge text can be specified to flow along the path in graphviz, with multi-line text support;
- every svg object, or at least every group is automatically treated as a view;
- the relationship among views is tree-like instead of linear;
- additionally, the user can optionally assign one or more customized linear orderings of views each representing a series of slides for a separate talk;
- the relationship among views and the linear order(s) can be defined in graphviz source file;
- there is an overview mode displaying the tree of views within a slide just like what we already have now for the entire set of slides -- the "index slide" displaying the list of slides within a jessyink file;
- change of views can be triggered by clicking on an object, a group, or a manually defined view;
- ESC or some other key takes us to the "parent view" in the view hierarchy;
- the gesture of defining a rectangle by drawing its diagonal dynamically creates a view and immediately takes us there;
With these features and whatever other more ingenious ones the FLOSS community come up with thru further discussions, I am sure few sane minds in the future would insist on using MS Powerpoint for presentation. For me, the only other attractive alternative to this combination would be the Anti PowerPoint Party's suggestions.